


Ask any question, in any way
Variety is the spice of learning
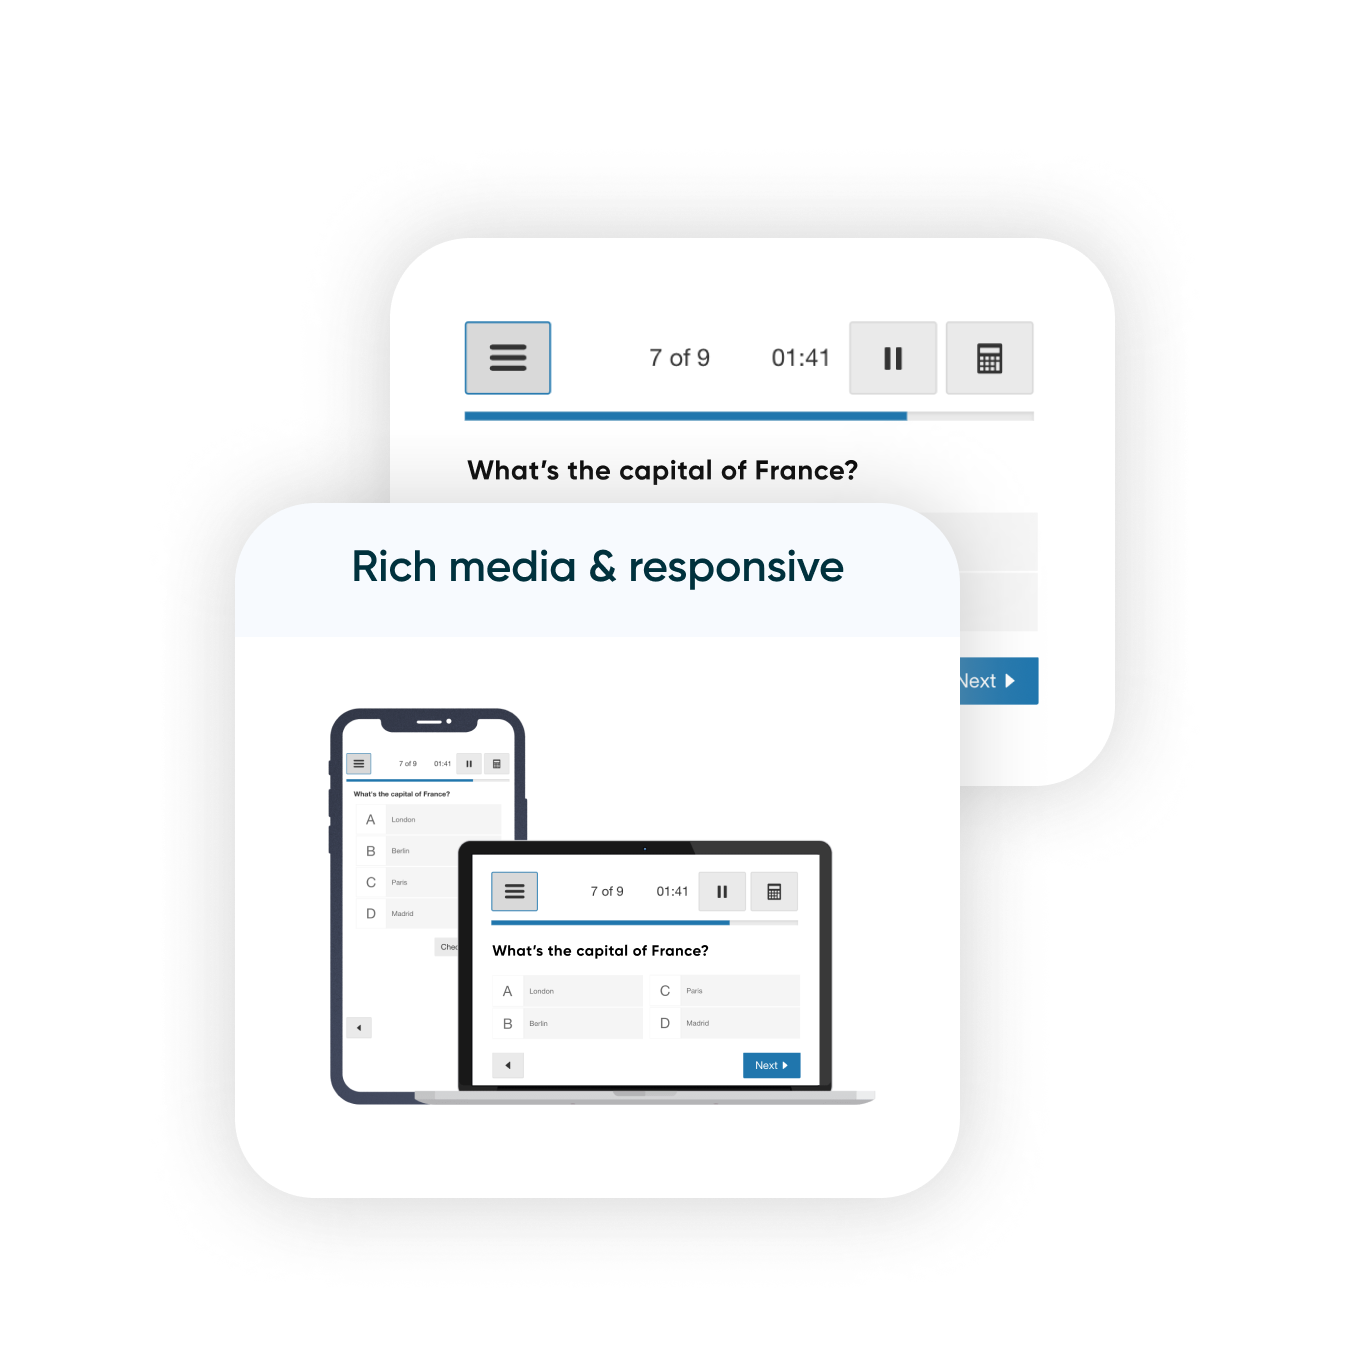
With 50+ prebuilt types of assessment questions and interactives to choose from across 9 categories, Learnosity opens up new possibilities to engage learners of all levels and disciplines—from STEM to visual arts to workplace training and beyond.
-
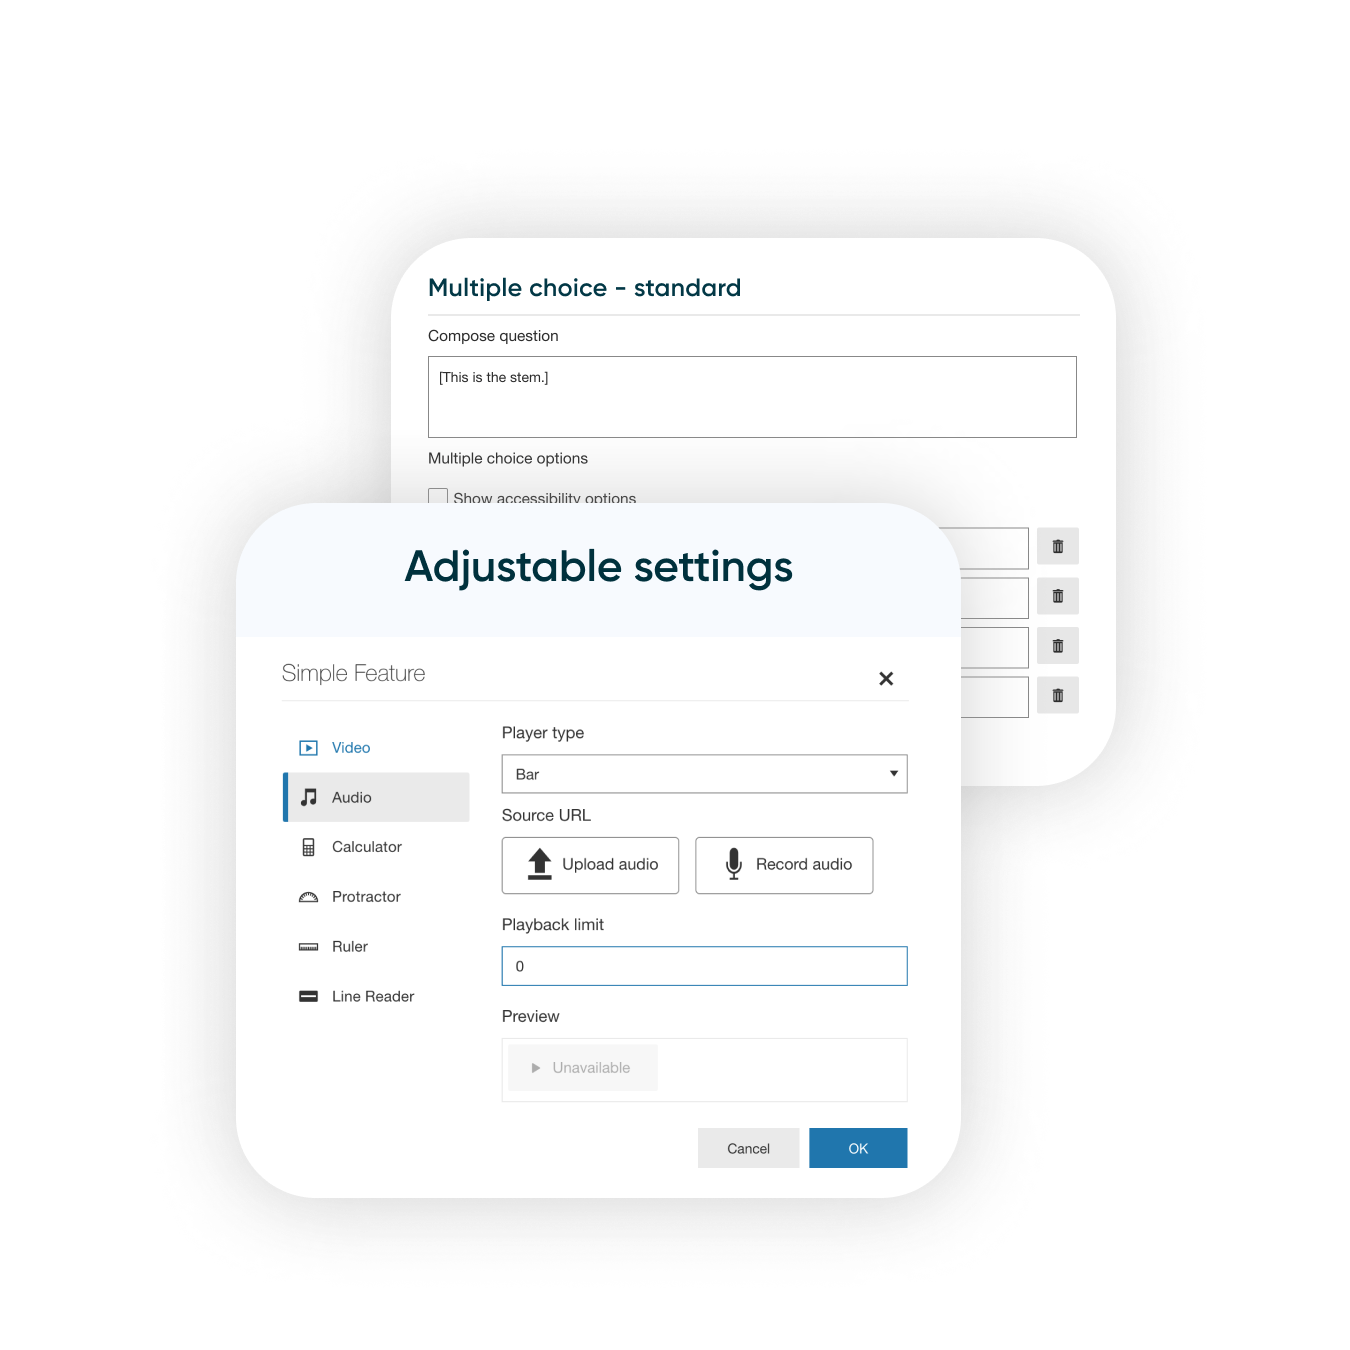
Multiple choice
Create MCQs that are as simple or sophisticated as you like with support for flexible layouts, images, audio, distractor notes, math content, and more.
-
Fill in the blanks
Easily create fill in the blanks questions using text, images, dropdowns, and drag and drop functionality.
-
Classify, match & order
Pair or order words, phrases, pictures, or symbols to see how learners create associations between lists of items.
-
Written, audio & visual
Give learners the tools to respond in their own words with short text, essay-length text, images, file uploads, and mobile-friendly video and audio capabilities.
-
Highlight
Illustrate your point with an assortment of interactive visual question types such as drawing, shading, highlighting, and hotspotting.
-
Math
Create complex, open-ended math assessment questions with multiple possible answers and have them auto-scored instantly by our custom-built math-scoring engine.
-
Graphing & charting
Generate sophisticated interactive charts, graphs, and number lines with ease then accommodate multiple possible answers with smart scoring.
-
Chemistry
Set and score advanced questions on molecular, empirical, and condensed structural formulas and give learners a flexible on-screen keypad to input responses.