


Optimize performance
Make assessments more effective
Get a bird’s eye view of the key drivers of learner engagement. By tapping into rich assessment insights, you can make data-powered improvements to content, product, and instruction.
-
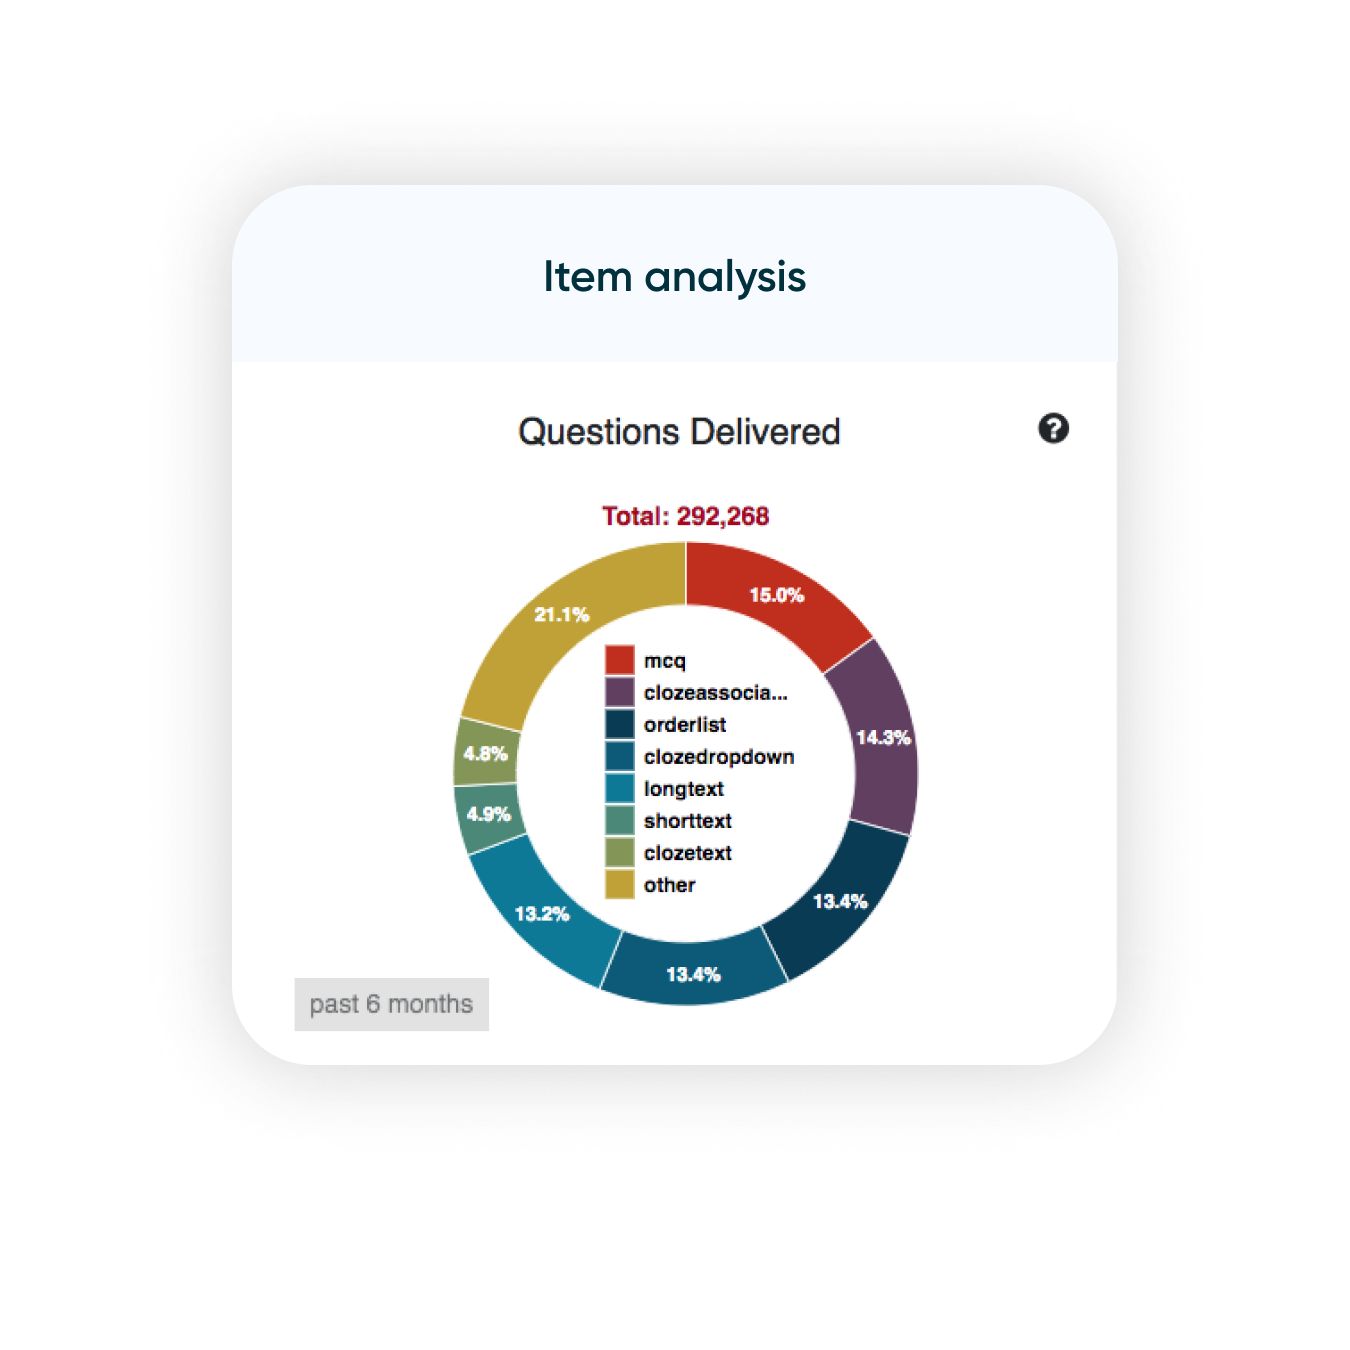
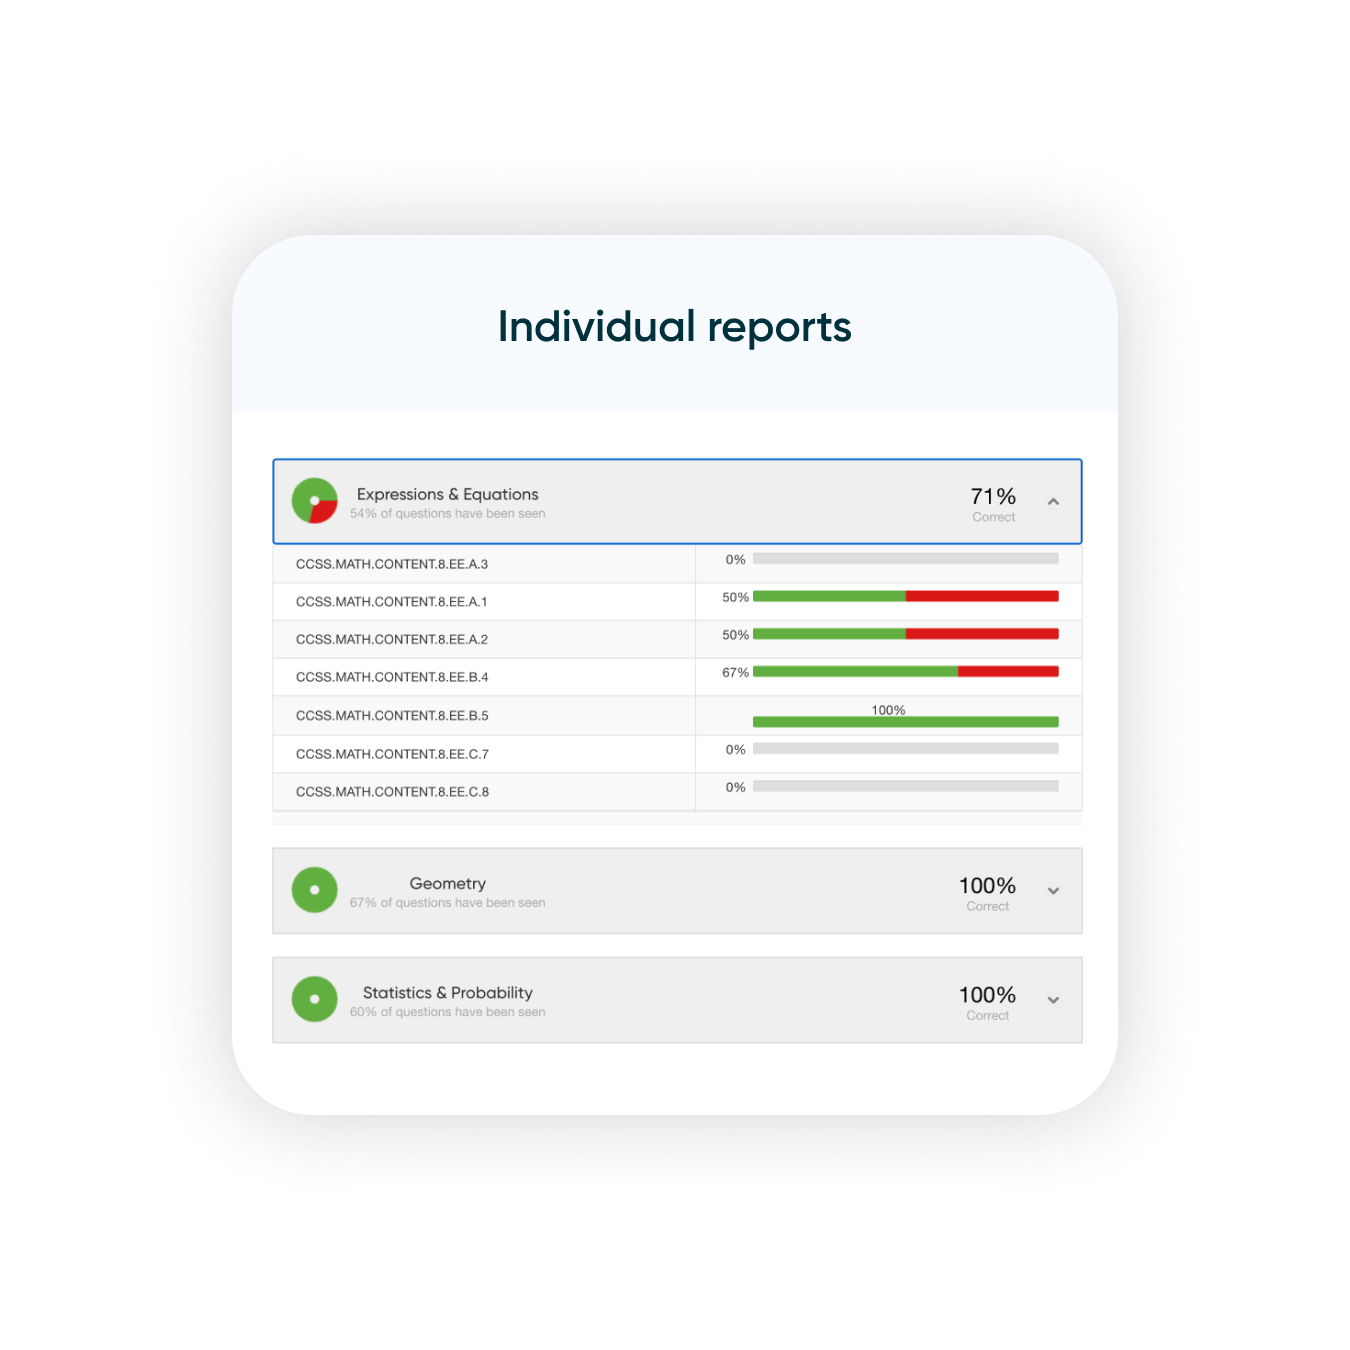
Item analysis
From large-scale analysis of entire item banks to more focused analysis of individual questions, item analysis tells you what’s working and what’s not.
-
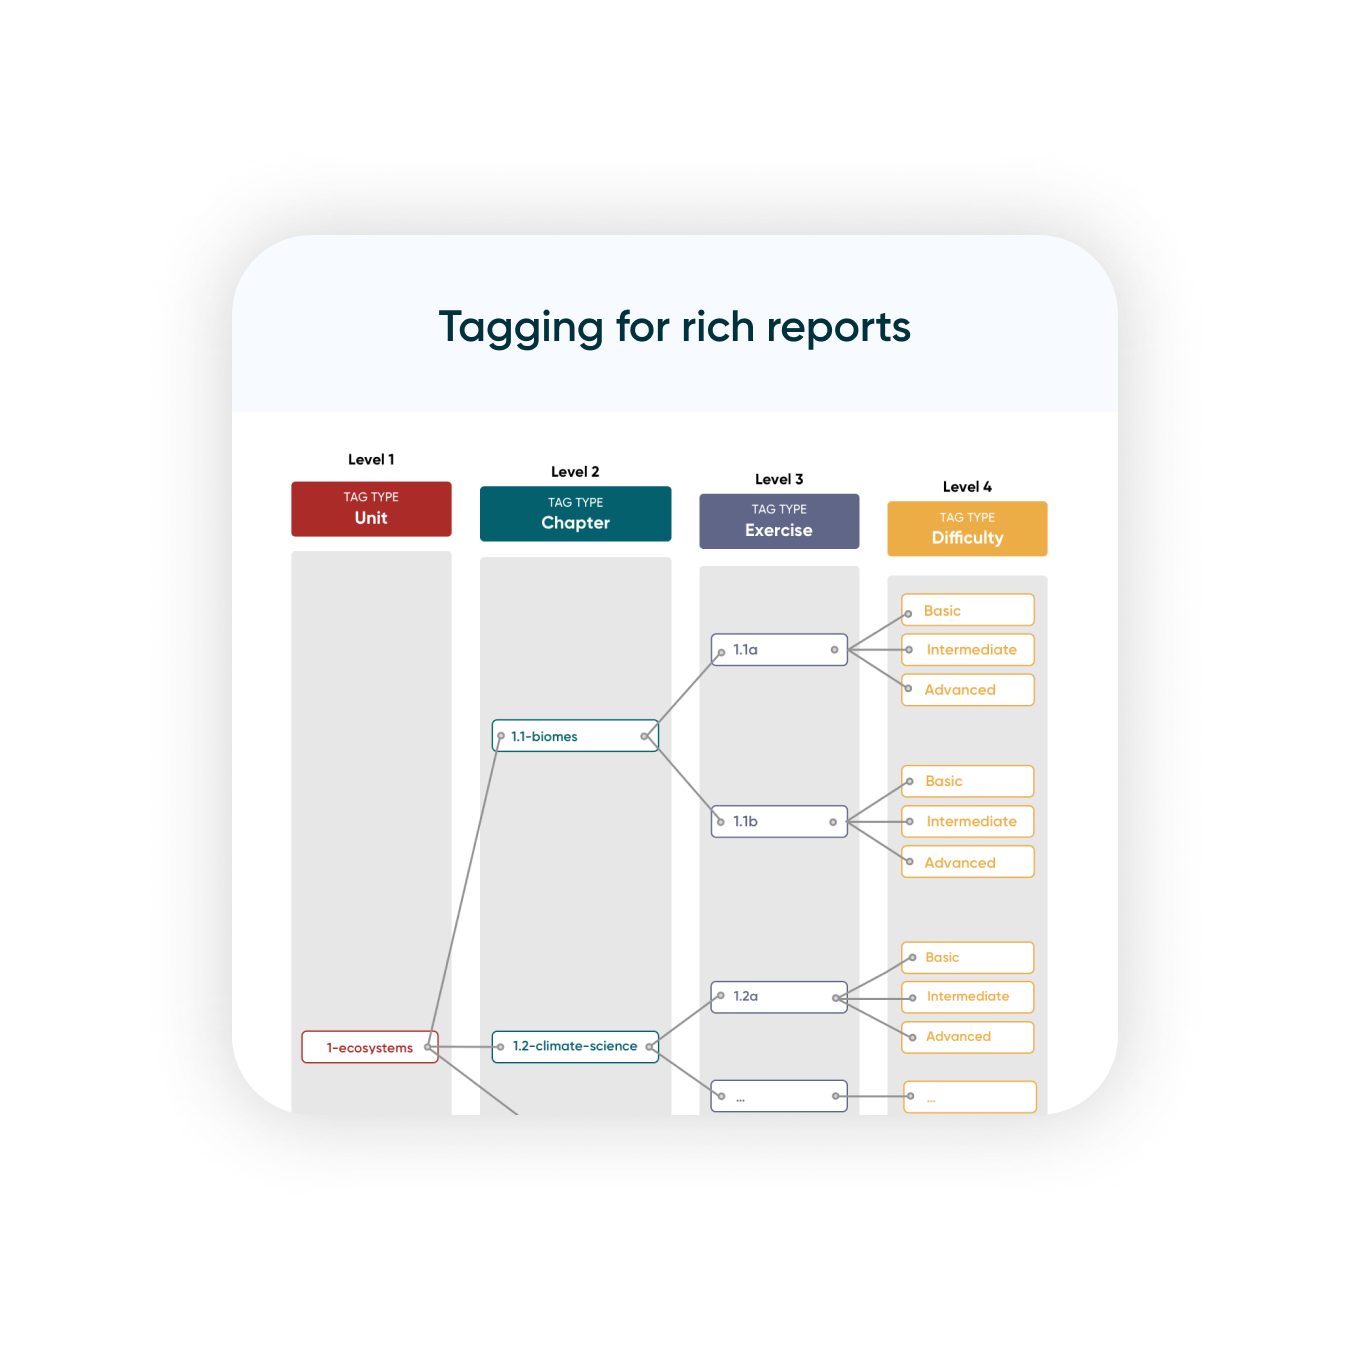
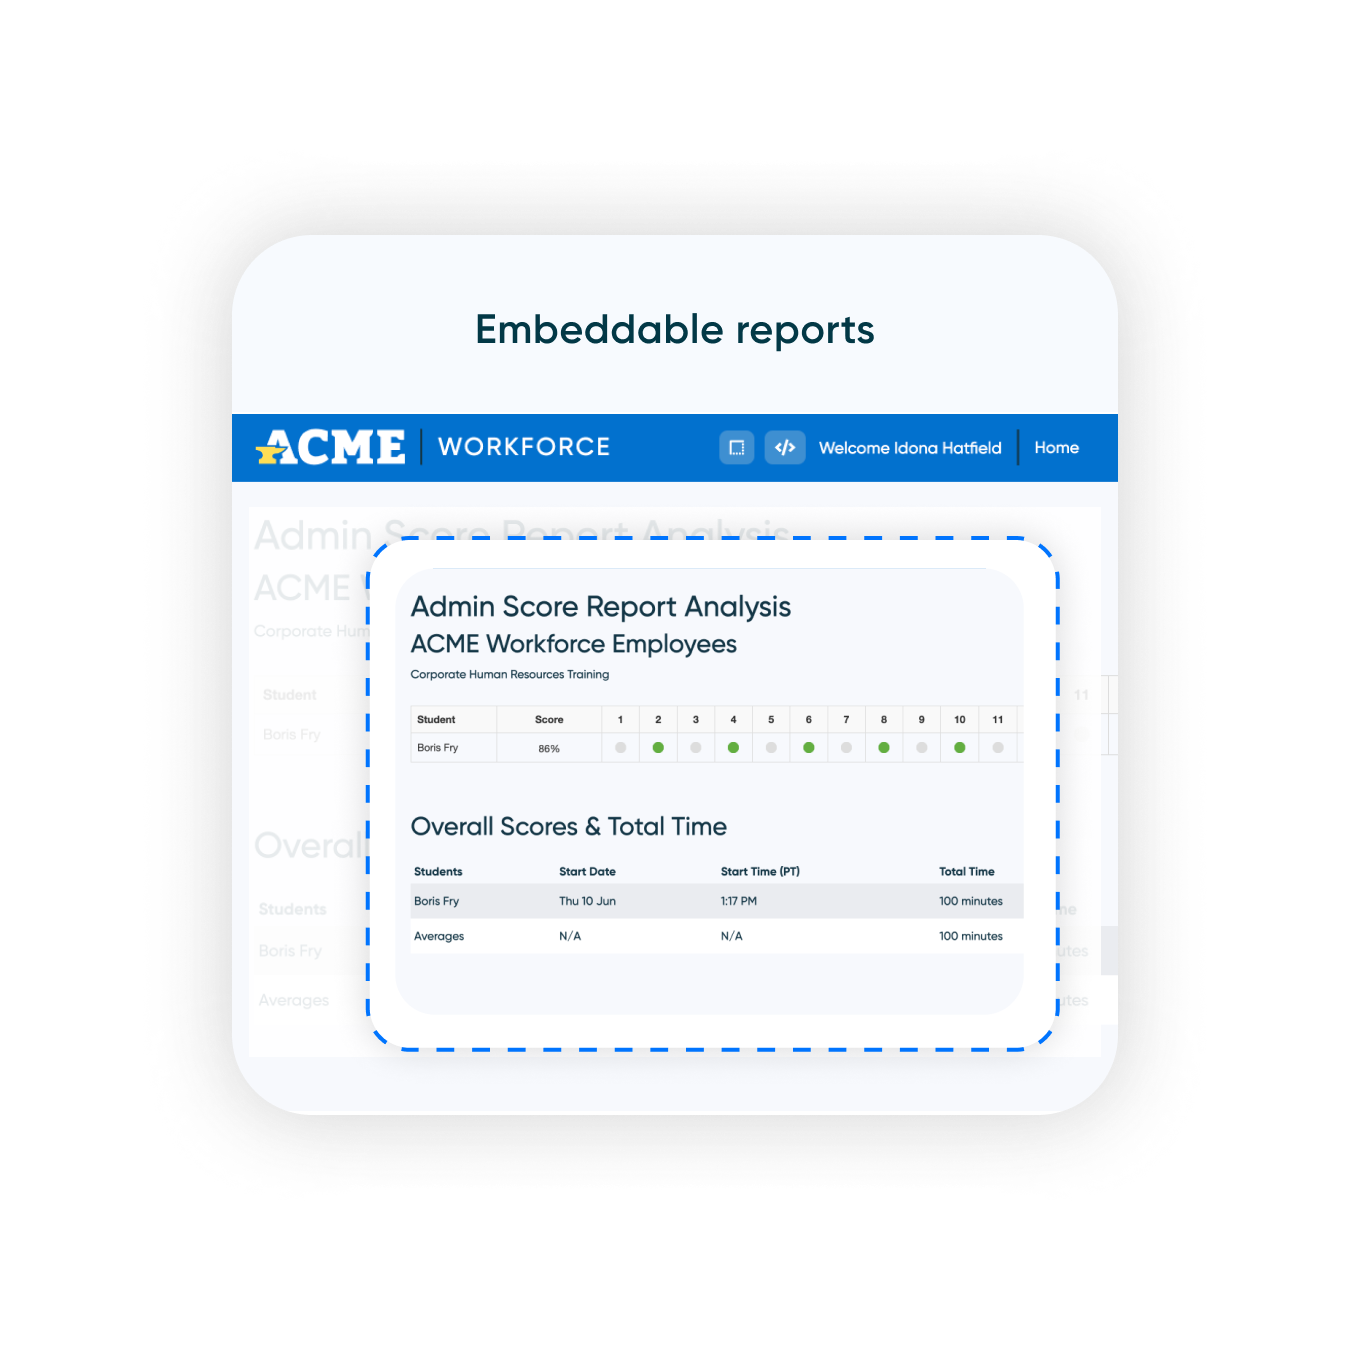
Tagging for rich reports
Easily set up key data touchpoints for richer, more granular assessment analytics. Create tag hierarchies to explore the finer details of reports.
-
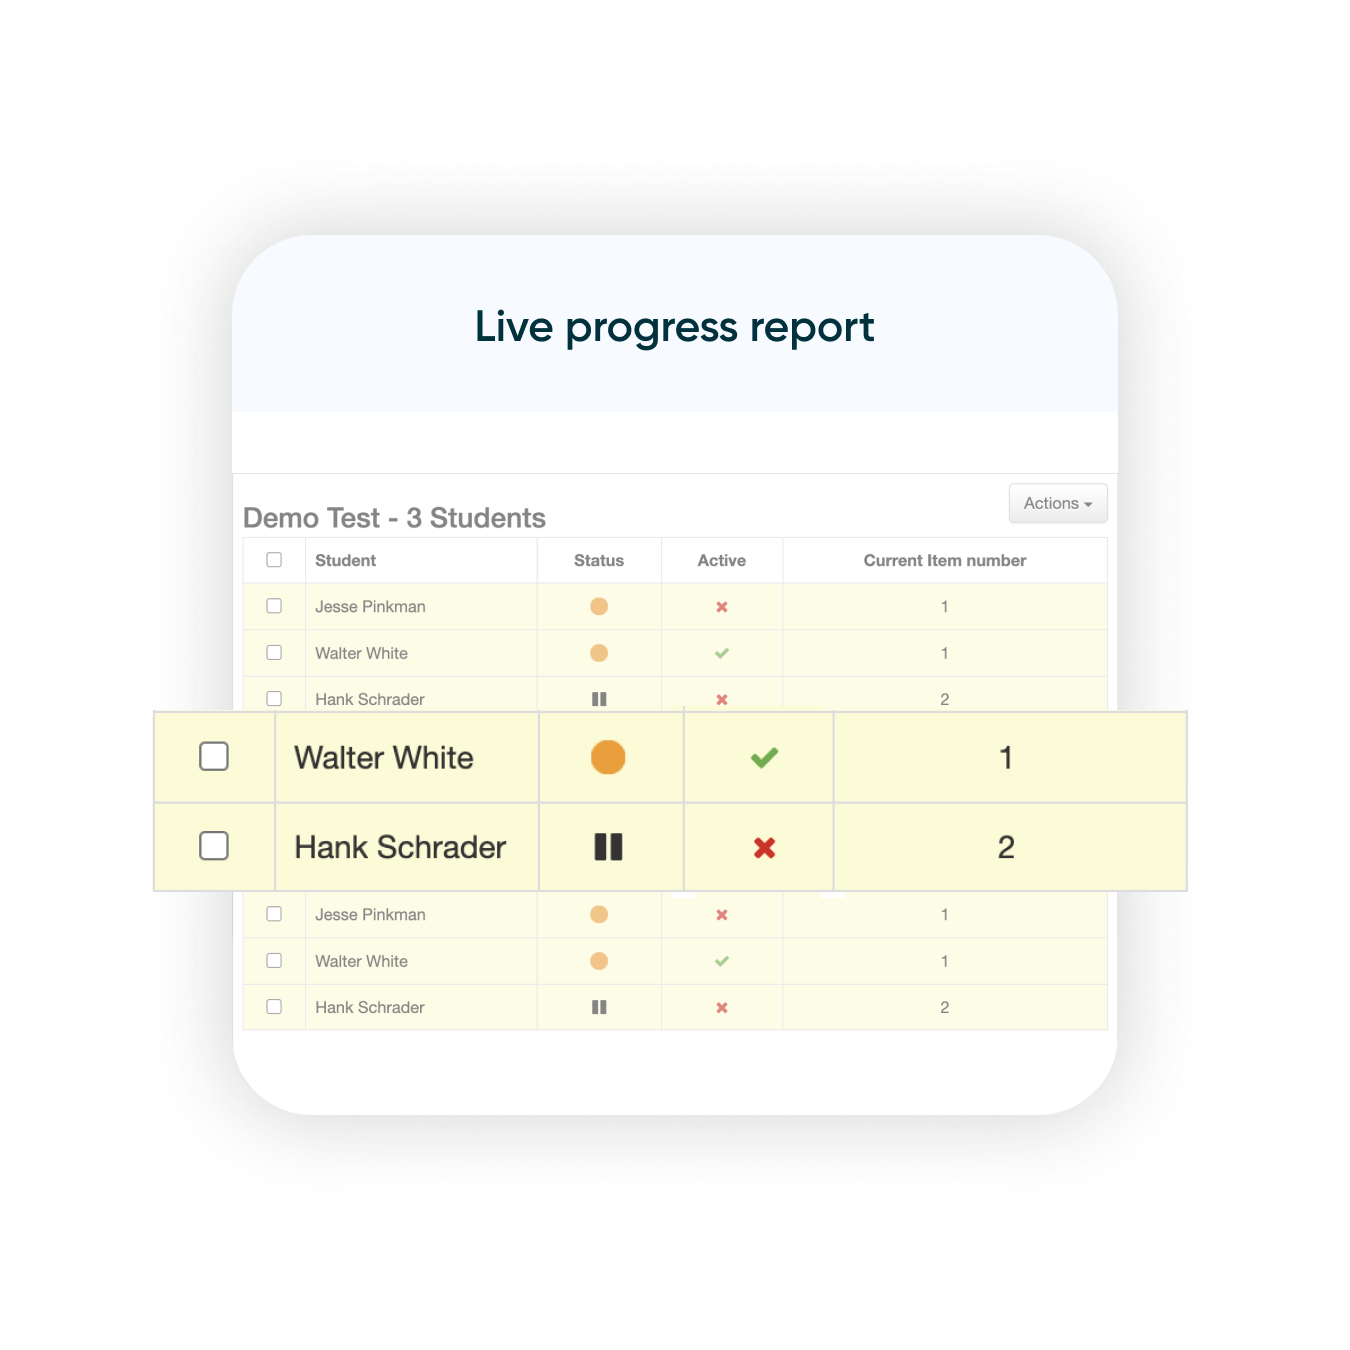
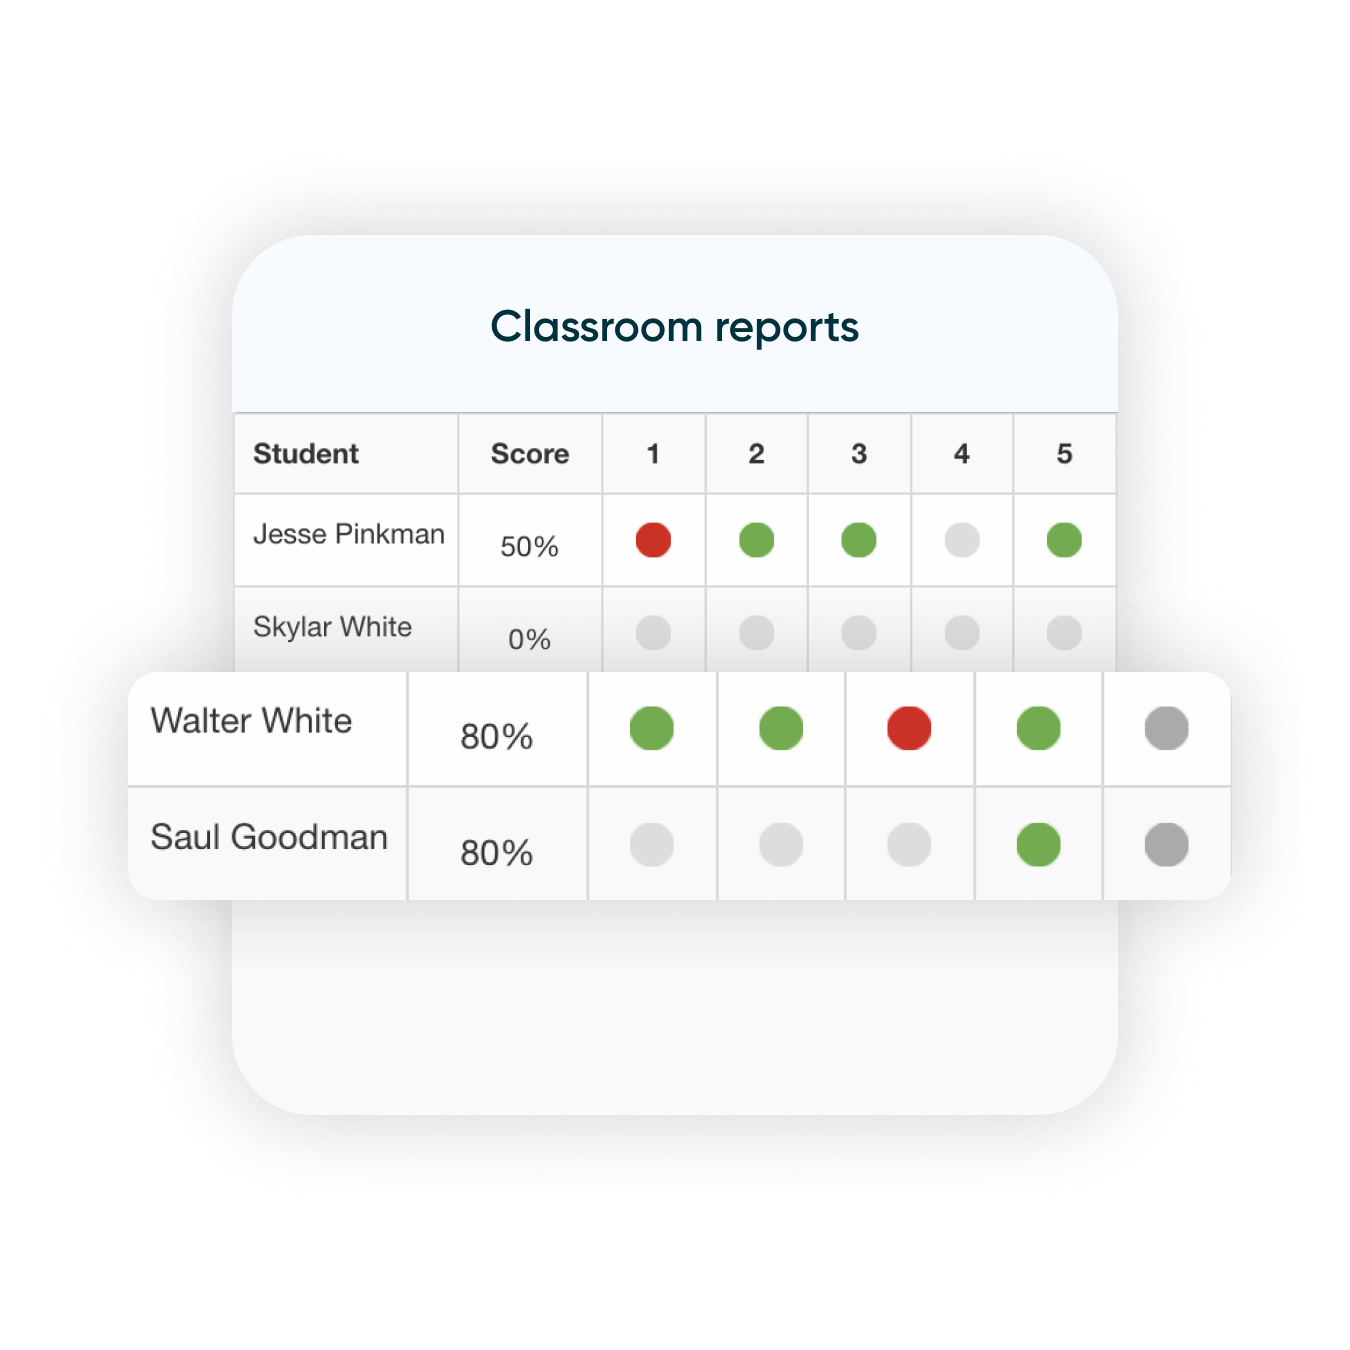
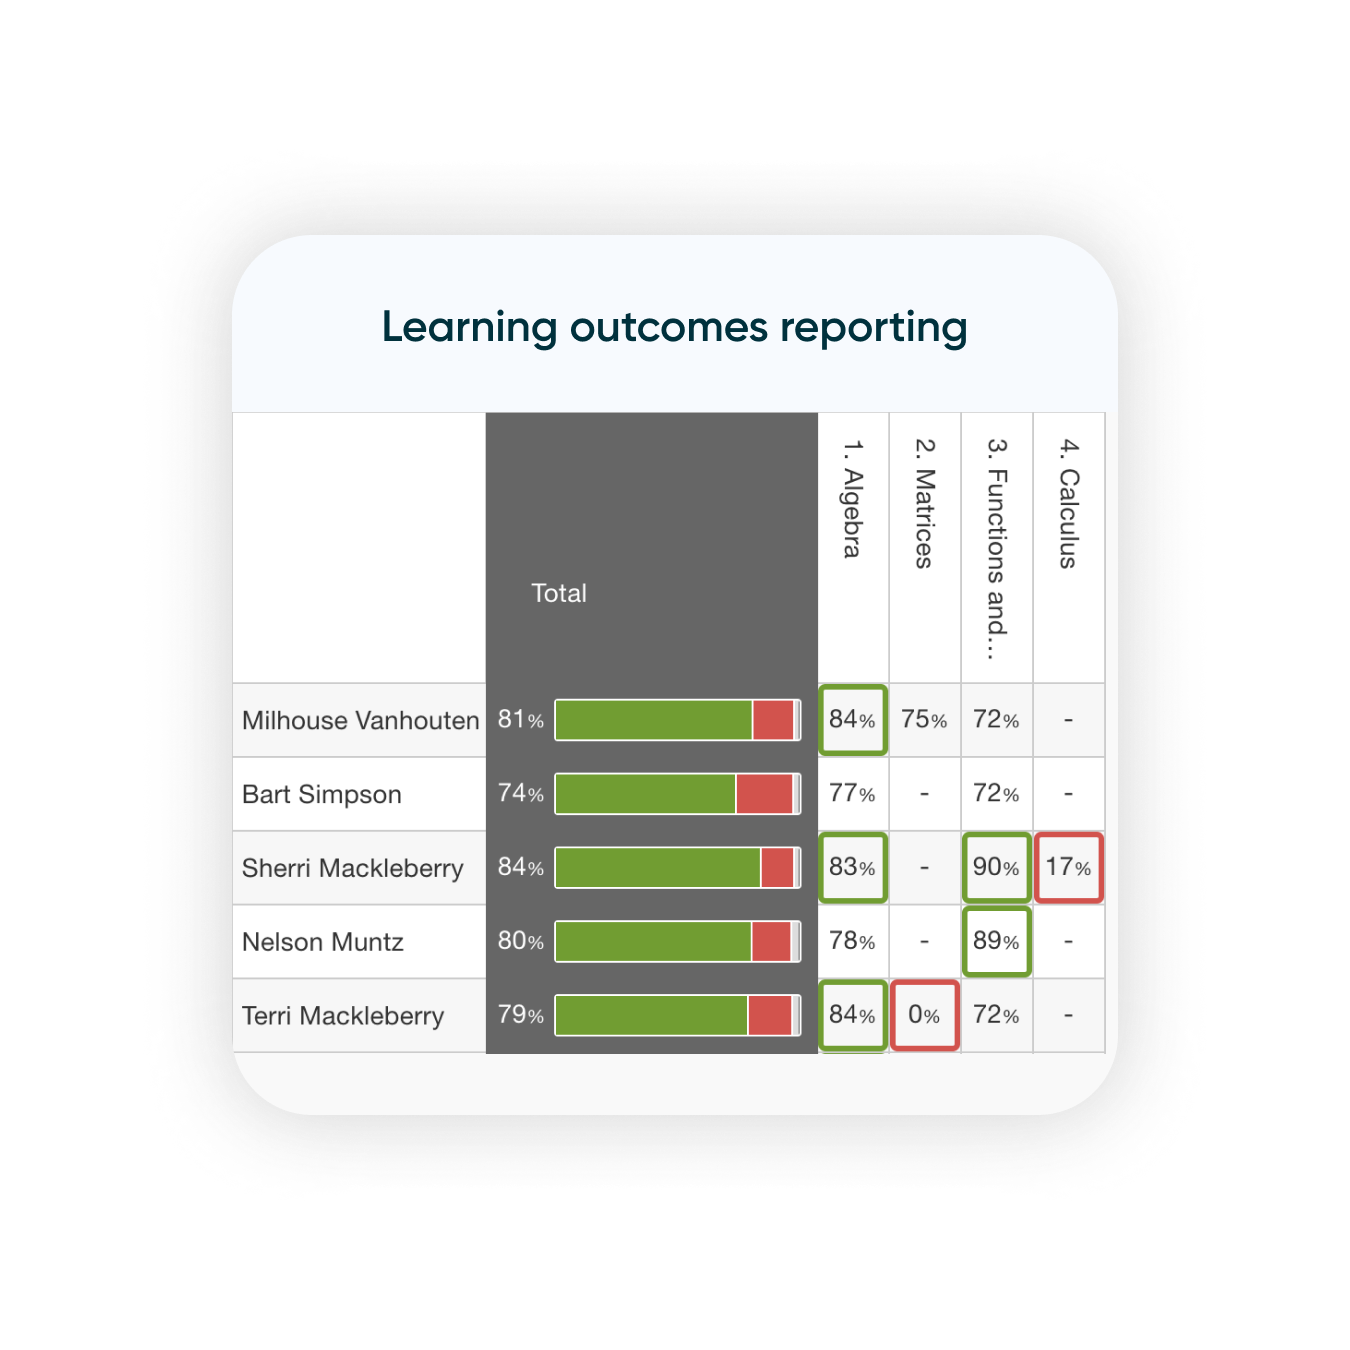
Live progress reports
See real-time progress with live student assessment analytics and guide their understanding with on-the-spot assistance.
-
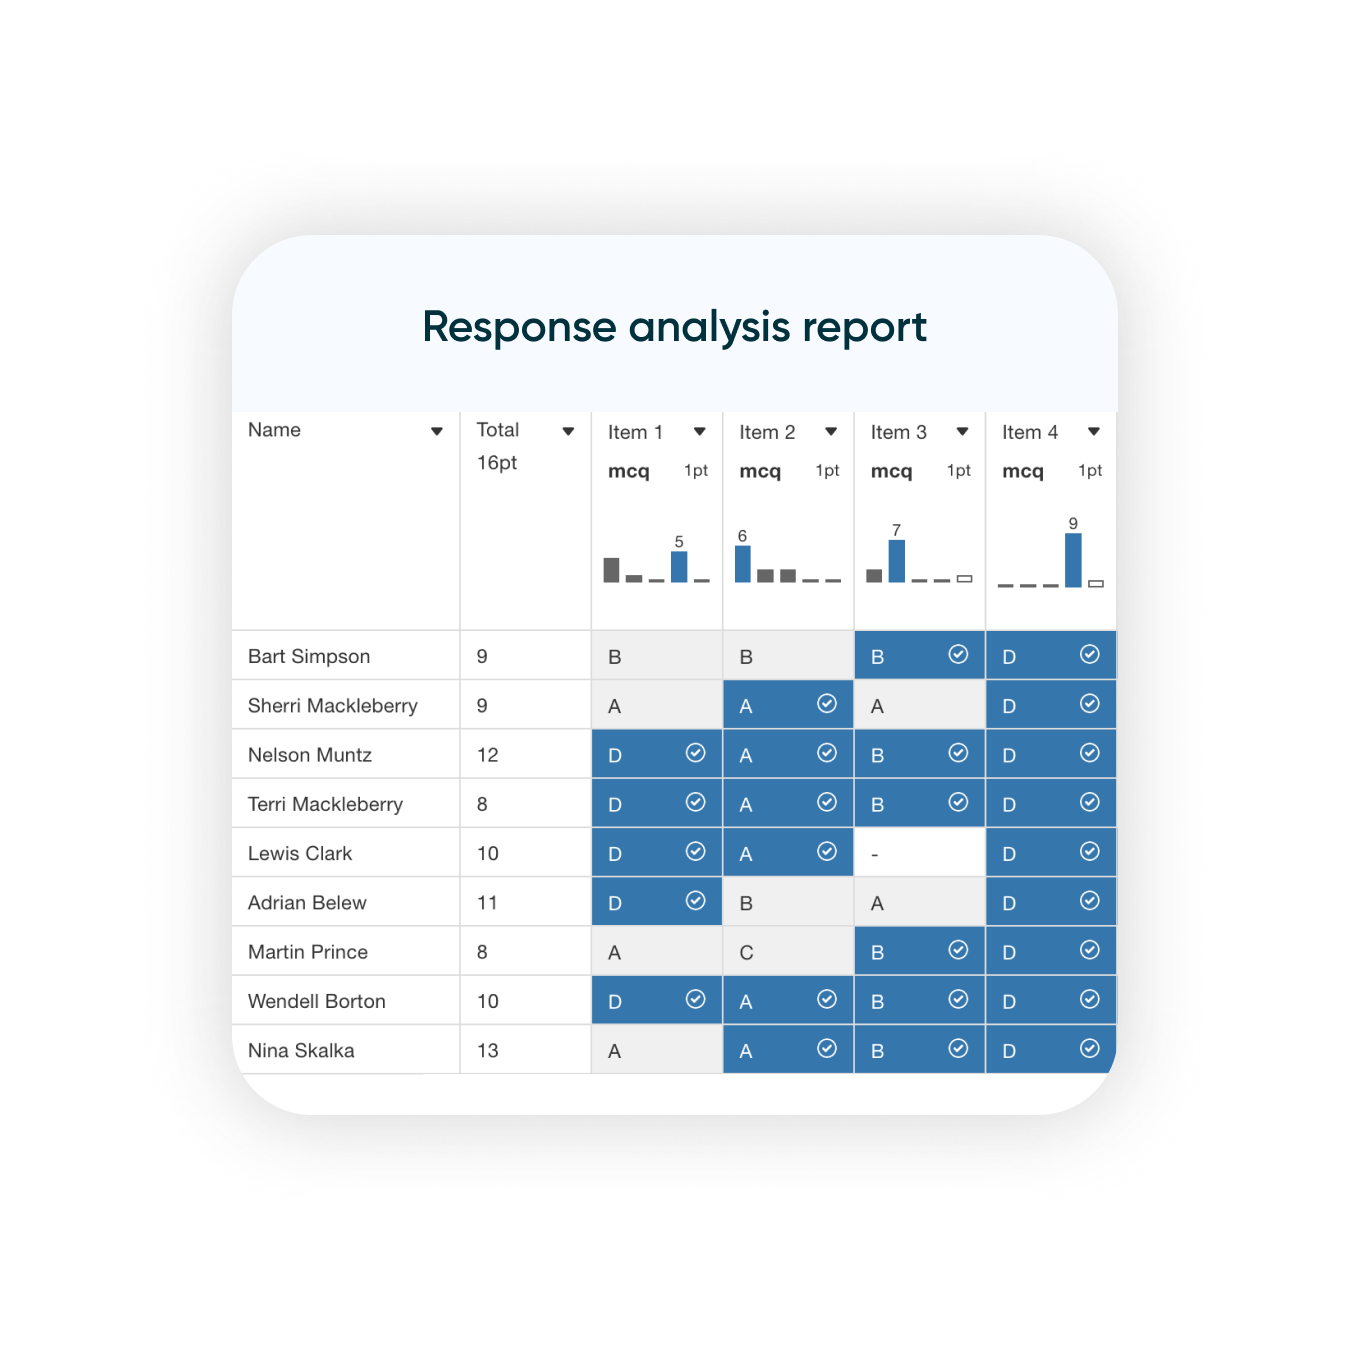
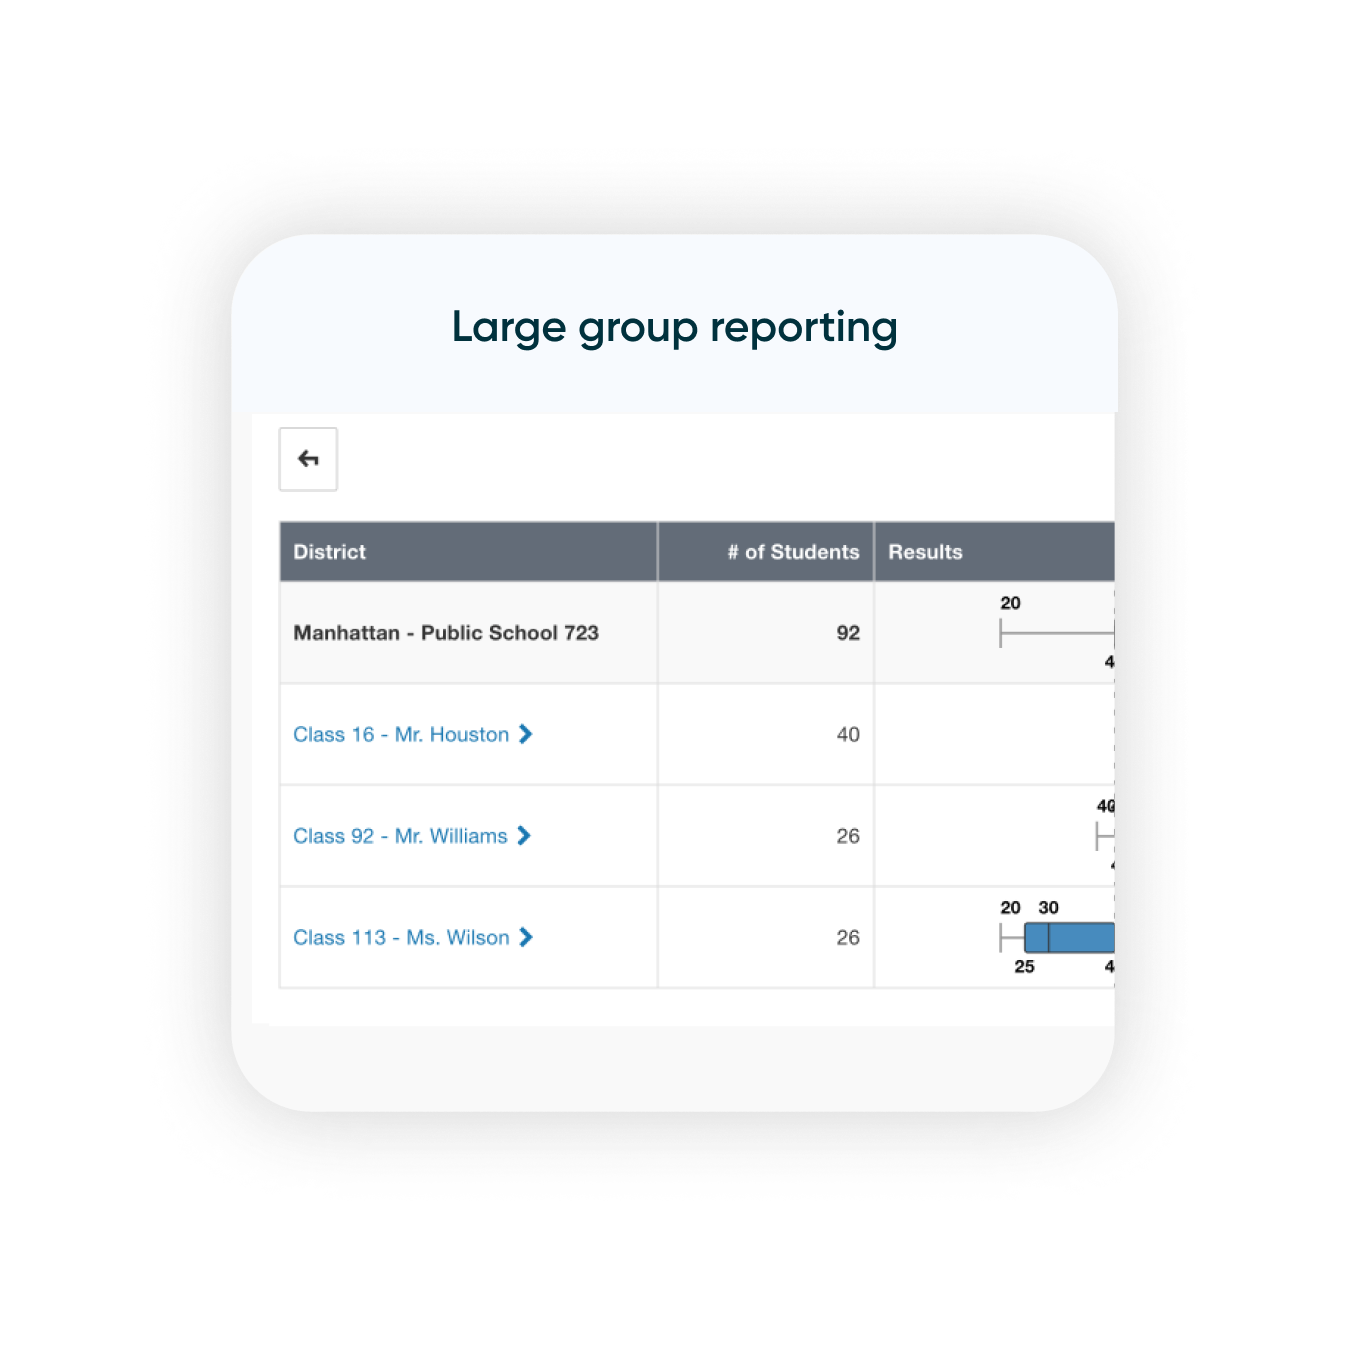
Response analysis report
Supercharge feedback loops with a report that lets educators spot common knowledge gaps fast—assessment analysis delivered in seconds.